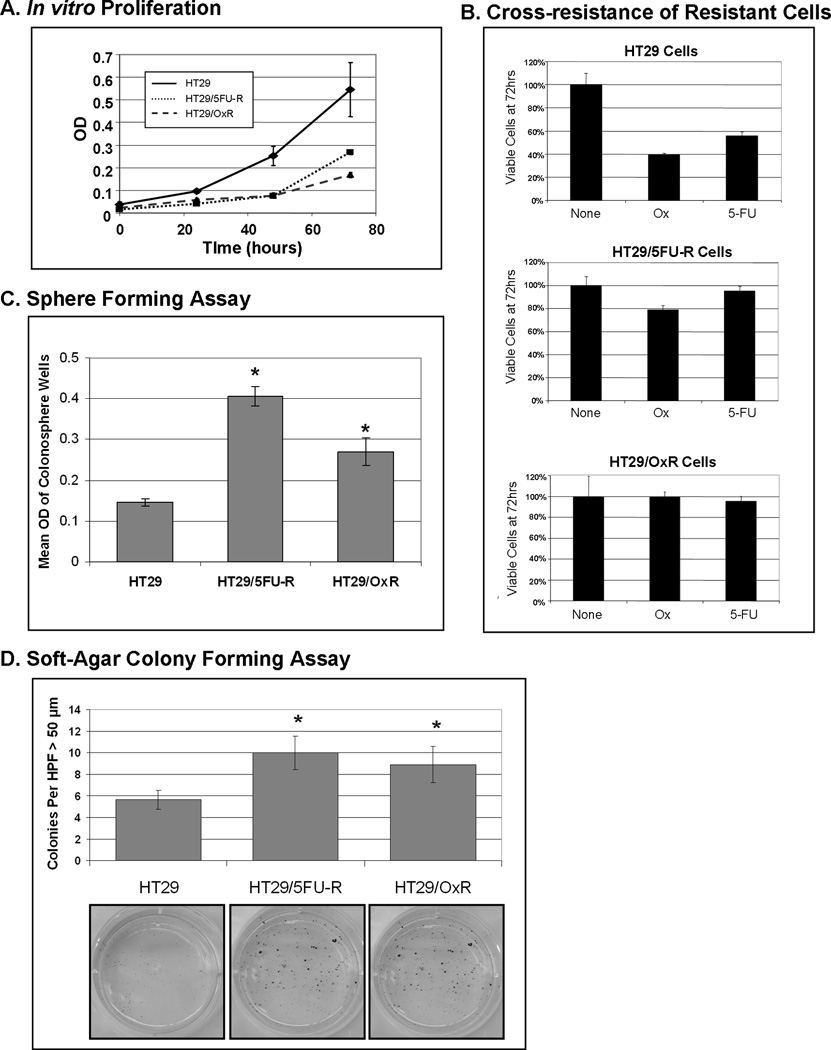
Figure 2. Chemoresistant cell lines are enriched for tumor stem cell phenotype.
(A) Chemoresistant cells proliferate at a significantly slower rate than do parental cells by MTT analysis. (B) Parental cells demonstrate sensitivity to both 5FU and oxaliplatin after exposure to drug for 72 hours, with only 40% and 58% of cells remaining, respectively, relative to untreated cells. In contrast, HT29/5FU-R cells are resistant to 5FU as expected; however, they also demonstrate an increase in resistance to oxaliplatin relative to parental cells. Similarly, oxaliplatin-resistant cells are resistant to oxaliplatin but also are resistant to 5FU. (C) Cells were plated in an ultra-low-attachment 96-well plate in the absence of serum, and 14 days later the number of viable sphere-forming cells was assayed by MTT. Chemoresistant cells demonstrated a 2- to 3-fold increase in colonosphere-forming cells relative to parental cells. (D) In a soft agar assay, 5FU- and oxaliplatin-resistant cells formed significantly more colonies larger than 50 µm in diameter under anchorage-independent growth conditions when compared to HT29 cells. These findings are consistent with the described CSC phenotype. Error bars represent standard error of the mean, and asterisks denote p<0.05. HPF=High Power Field. OD = optical density.

