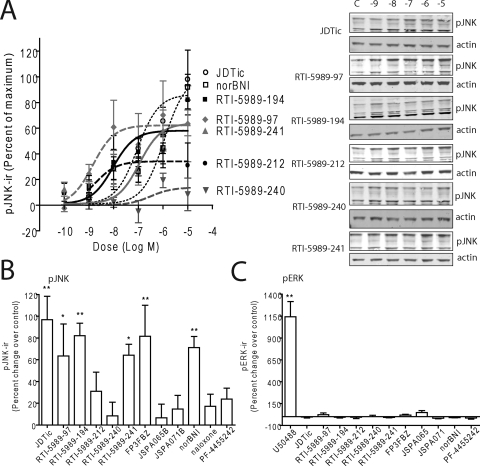
Fig. 2.
Activation of JNK in HEK293 cells by κ-opioid antagonists. A, dose response curves generated from pJNK-ir quantification of western blots for JDTic, RTI-5989-97, RTI-5989-1 RTI-5989-94, RTI-5989-212, RTI-5989-240, RTI-5989-241, and nor-BNI (Western blot not shown). All compounds were administered for 60 min before lysing the cells. B, quantification of pJNK-ir from Western blots of cell lysates from cells treated with 10 μM concentrations of each compound for 60 min. C, quantification of pERK-ir from Western blots of cell lysates from cells treated with 10 μM concentrations of each compound or U50,488H for 5 min. Results were compared with vehicle controls and analyzed by one-way ANOVA with Bonferroni post hoc comparisons (*, p < 0.05; **, p < 0.01; ***, p < 0.001).

