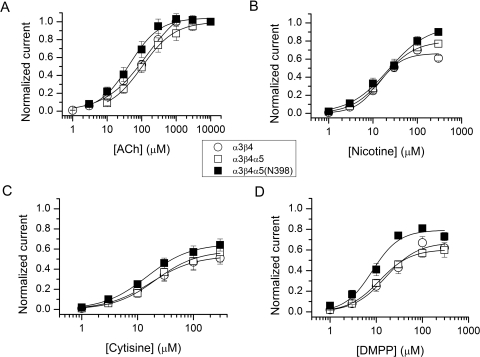
Fig. 1.
Summary of activation concentration-response curves. The plots show concentration-response curves for ACh (A), nicotine (B), cytisine (C), and DMPP (D) for HEK cells stably expressing human α3β4 receptors or stable α3β4 cells transiently transfected with wild-type or variant (Asn398) α5 subunits. The α5 subunits contained a FLAG epitope inserted to the amino terminus of the subunit. Cells expressing the α5 subunit were selected with immunobeads coated with anti-FLAG antibody. Each data point represents mean ± S.E.M. from four to seven cells. The data were normalized to the highest ACh concentration used (A) or to the 1 mM ACh response obtained from the same cell (B–D). The curves were fitted with the Hill equation. The fitting results are given in Table 1.

