Fig. 2.
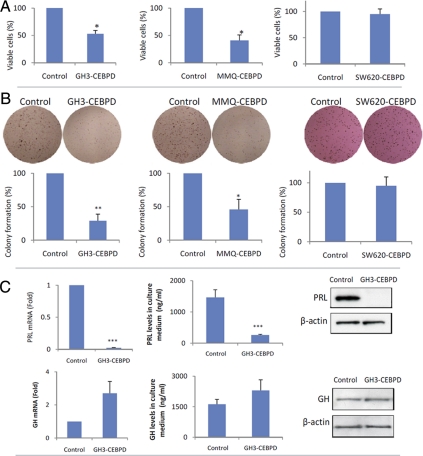
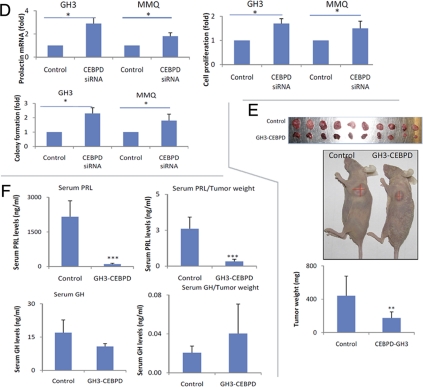
Overexpression of CEBPD suppresses cell proliferation and PRL expression. A, GH3 and MMQ cells overexpressing CEBPD (GH3-CEBPD or MMQ-CEBPD) proliferated slower than corresponding cells expressing EV (control, GH3-EV, or MMQ-EV). Antiproliferative effects of CEBPD were not observed in SW620 cells (mean ± sd, n = 3; *, P < 0.05). B, GH3-CEBPD, MMQ-CEBPD, and SW620-CEBPD cells and controls expressing EV (GH3-EV, MMQ-EV, or SW620-EV) were subjected to soft agar colony formation assay. Colonies were counted manually under a microscope (mean ± sd, n = 3; *, P < 0.05; **, P < 0.01). C, Total RNA was extracted from GH3-CEBPD and GH3 cells expressing EV (control) and analyzed using real-time PCR for PRL and GH mRNA levels. PRL and GH from GH3-CEBPD and control cells were analyzed using Western blot, and medium PRL and GH levels were measured by RIA (mean ± sd, n = 3; ***, P < 0.001). D, Scrambled (control) or CEBPD siRNA was transfected into GH3 or MMQ cells, cell proliferation was measured by WST-1 assay, and total RNA was extracted for real-time PCR analysis (mean ± sd, n = 3; *, P < 0.05). E, Twenty one days after sc injection into nude mice, GH3-CEBPD cells developed smaller tumors than GH3-EV (control) cells (mean ± sd, n =10; **, P < 0.01). F, Serum was collected from tumor-harboring mice, and PRL levels were measured (mean ± sd, n = 10; **, P < 0.001). PRL levels per mg tumor weight were calculated. G, GH3-CEBPD tumors secreted less PRL than GH3-EV (control), but GH levels per mg tumor tissue were similar.


