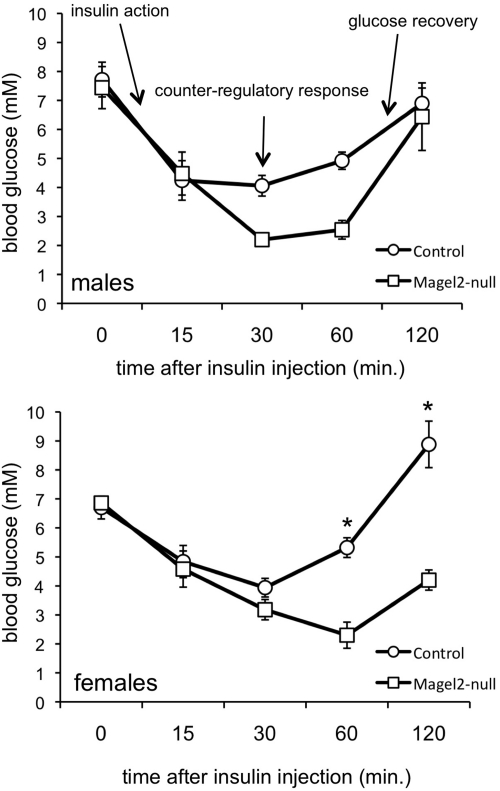
Fig. 3.
IPITT in control (circles) and Magel2-null (squares) mice. Values represent the mean ± sem; n = 5–8 per group. There was no difference in the overall response in the male mice (two-way ANOVA with repeated measures). However, there was a significant effect of genotype in female mice [F(1,32) = 20; P = 0.002, two-way ANOVA with repeated measures], and post hoc testing revealed differences between genotypes at 60 and 120 min (*, P < 0.002). Additional interpretation of the IPITT is provided in the text.

