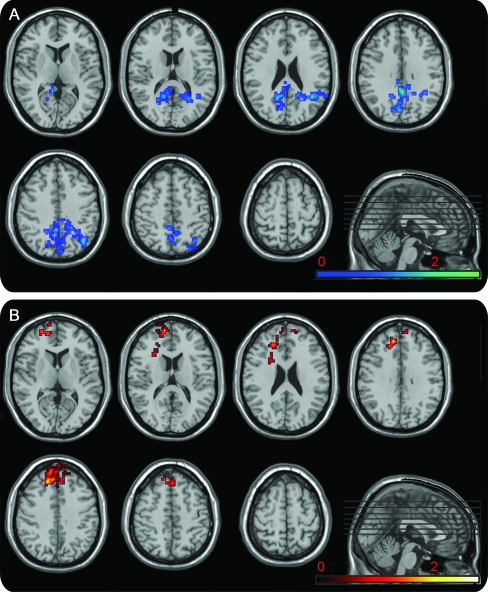
Figure 3. Conjunction analysis.
Conjunction analysis between the age cohort regression and the 2-sample t test between the subjects with Alzheimer disease (AD) and matched controls using the independent components for the posterior (A) and anterior (B) default mode networks (DMNs). The result for the voxels that showed both age-related decreases in posterior DMN connectivity and decreases in AD are shown in blue (A). The result for the voxels that showed both age-related increases in anterior DMN connectivity and increased connectivity in the AD group are shown in red (B). Results are displayed on a standard template using MRIcro with the color bar coding the t score (cluster-corrected p < 0.05).

