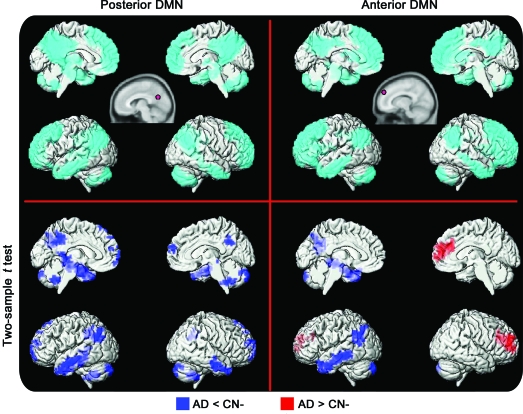
Figure 4. Alzheimer disease (AD) vs cognitively normal (CN) using seeds.
Seed-based analysis of posterior (left) and anterior (right) default mode networks (DMNs) in subjects with AD and matched controls. The spatial extent of the anterior DMN and posterior DMN is displayed in the top row (cyan) using a rendering of a 1-sample t test for the entire group (false discovery rate–corrected p < 0.05). The seed location and size are approximated in the top row inset (pink circle). Regions displaying greater connectivity in the AD group are in red, and regions displaying less connectivity in AD are in blue (corrected cluster-level p < 0.05).

