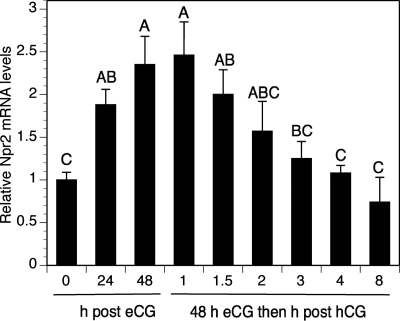
Fig. 2.
Gonadotropin control of Npr2 mRNA expression in cumulus cells in vivo by qRT-PCR. The mean value in the control (0-h eCG treatment) was set at a value of 1, and expression levels in other samples are shown relative to the control. Bars show the mean ± sem of four independent samples. Relative expression levels not connected by the same letter are significantly different (P < 0.05).

