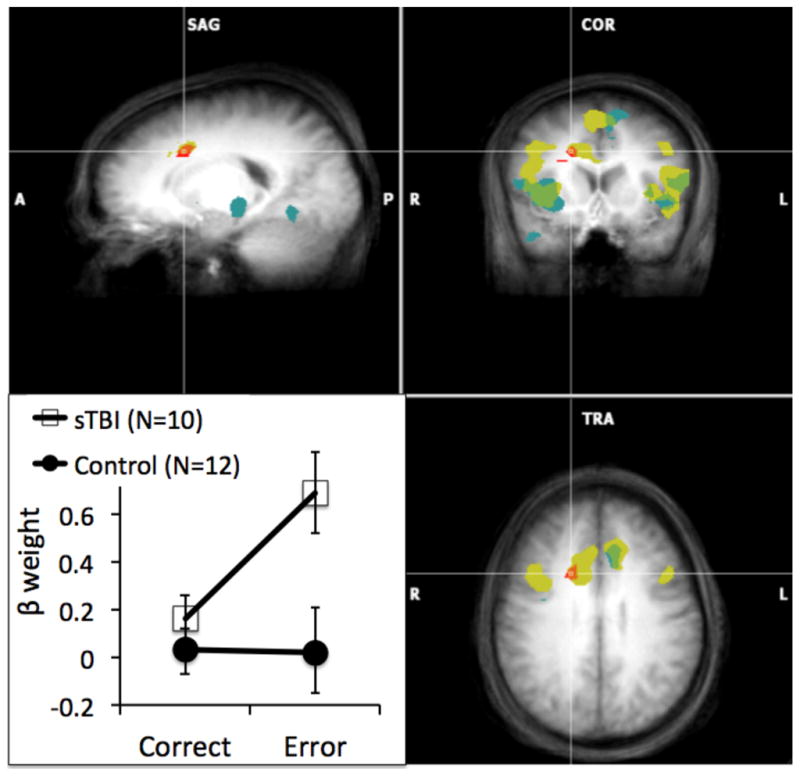
Figure 4.

Brain regions of patients with TBI and healthy comparison participants illustrating significant error-related activity (incorrect > correct). Results from the individual-group analyses: Yellow illustrates significant error-related activity in TBI patients, blue illustrates error-related activity in healthy controls, and green illustrates error-related activity in in which the TBI patients and healthy controls overlap. Results from the between-group analysis: Red illustrates a region of the anterior cingulate cortex (ACC) in which there is a Group x Accuracy interaction; graph insert in lower left illustrates beta weights showing the interaction effect. Error bars reflect standard errors. Statistical maps are superimposed on the three-dimensional structural MRI averaged over all participants. (L = left; R = right; Talairach coordinates of images shown = 18 11 34).
