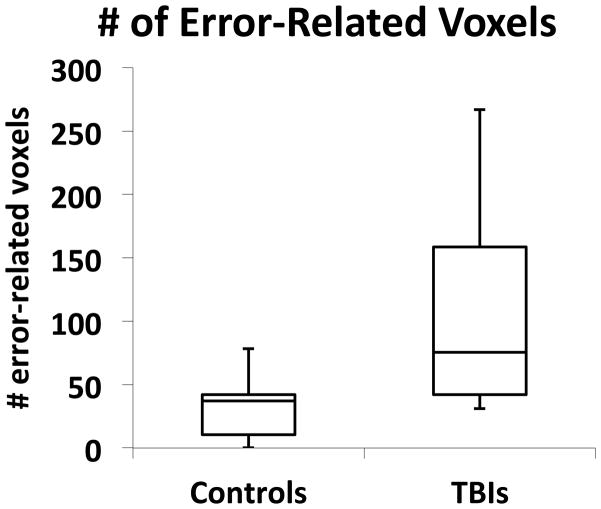
Figure 5.
Box plots illustrating the total number of suprathrehold error-related voxels as a function of group as derived from the separate-groups contrast error > correct response. Bottom and top of each box represent the lower and upper quartiles, respectively, and the band near the middle of the box reflects the 50th percentile (median); upper and lower whiskers reflect the maximum and minimum number of voxels.3

