
Figure 2.
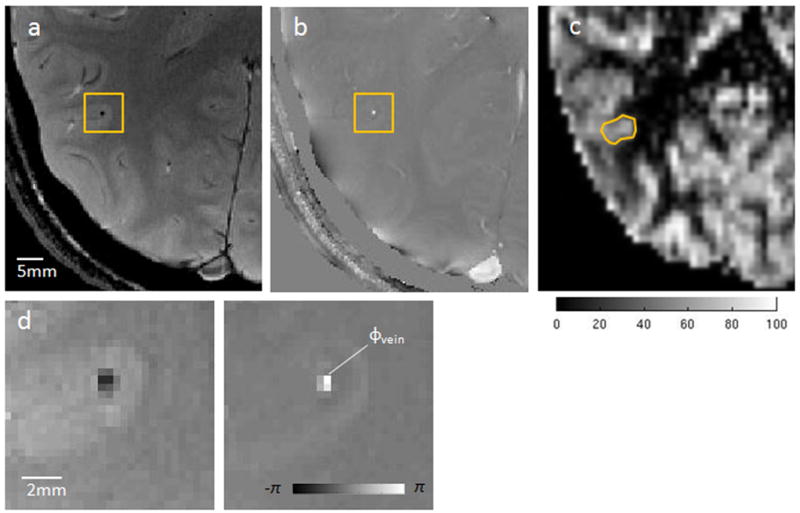
Illustration of PROM for quantification of Yv and CMRO2. (a) Axial magnitude; and (b) phase image from a 2D gradient echo acquisition. The rectangle highlights a through-plane gray matter vein of interest. (c) CBF map (ml/100g/min) from the corresponding slice in ASL acquisition with ROI used to measure regional perfusion of the identified vessel. (d) Zoomed view magnitude and phase (in radians) for the gray matter vein, where ϕvein is the representative phase value within the vessel.