
Figure 6.
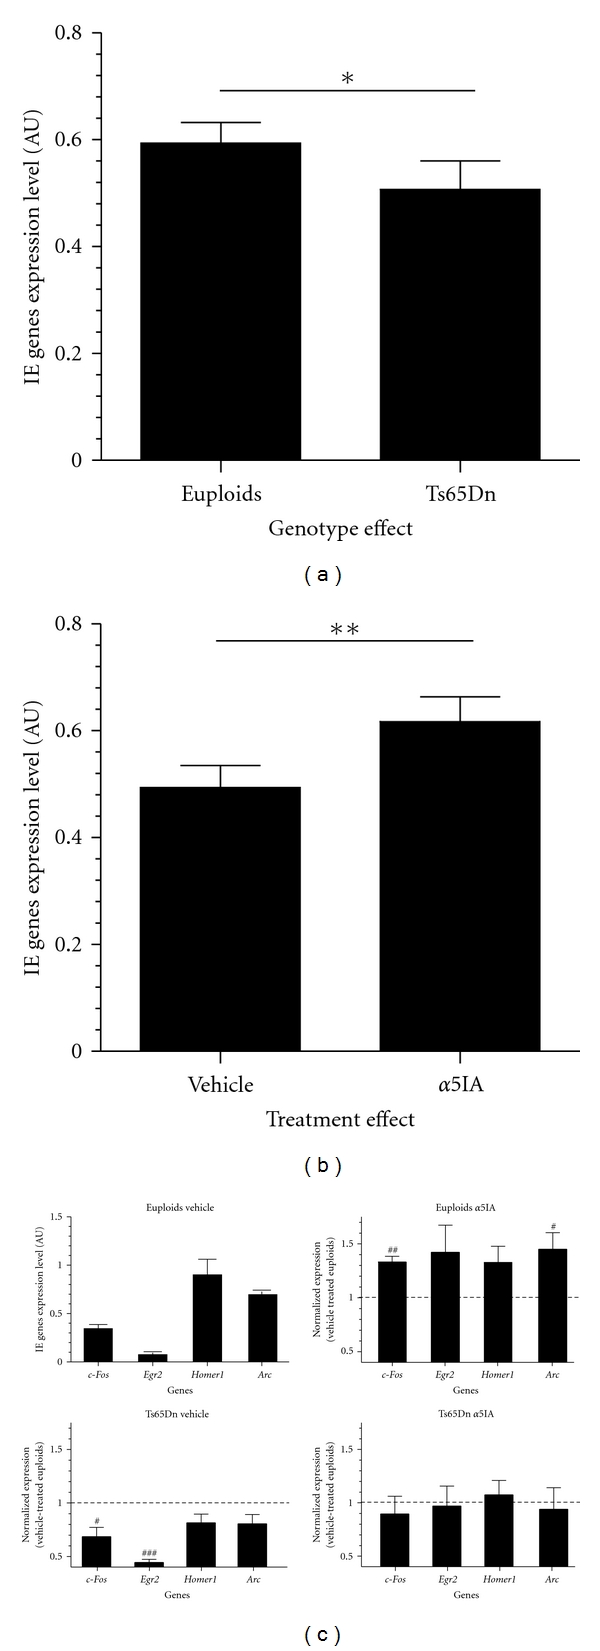
QPCR expression level of selected IEGs. (a) Mean cumulated expression levels of five selected IEGs in euploid and Ts65Dn mice; (b) effect of α5IA treatment on the mean level of expression of five selected IEGs; (c) expression of c-Fos, Egr2, Bdnf, Homer-1, and Arc in the four genotype and treatment experimental groups. *P < .05, two-way ANOVA with Fisher's post hoc comparisons; # P < .05, ### P < .001, and one-sample t-test.