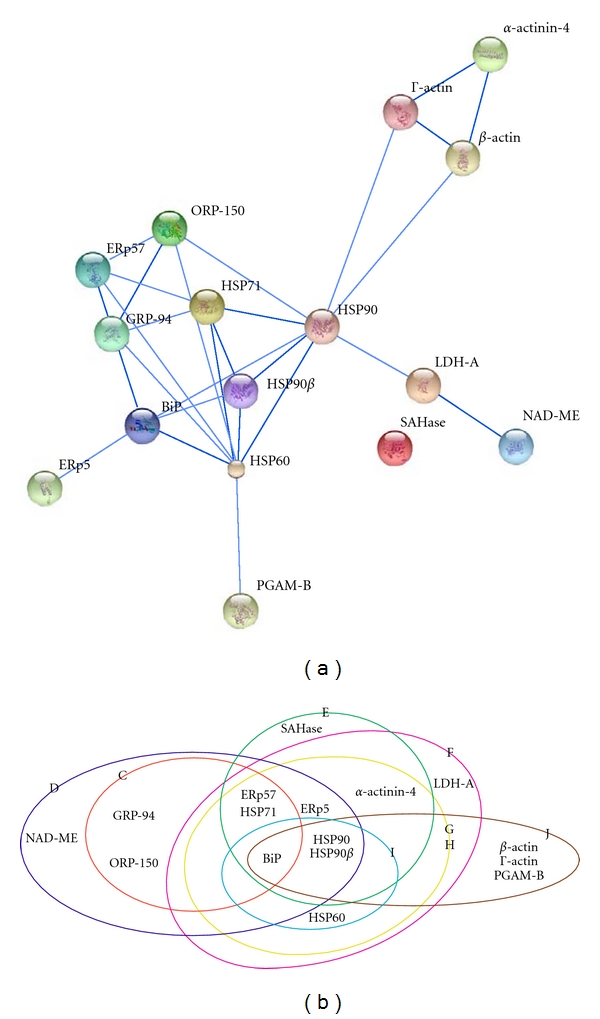
Figure 2.

Interaction analysis of proteins from the HSP-associated complexes using the STRING database. The lines represent interactions and individual proteins are depicted as nodes. Stronger interactions are represented by thicker lines (a). The HSP-associated complexes from this study are shown in different ellipses. The sign of each protein complex is indicated on the edge of each ellipse (b).
