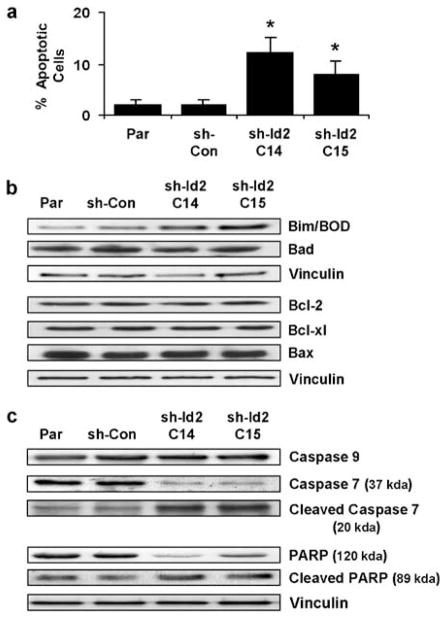
Figure 3.
Effect of Id2 expression on apoptosis in HCT-116 cells. (a) Graphical representation of proportions of apoptotic control cells (Parental (Par) and scrambled-siRNA control (sh-Con)) and stable cell lines with reduced Id2 expression (sh-Id2C14 and sh-Id2C15) as determined by fluorescence-activated cell sorting analysis. (b) Western analysis of Bcl-2 family members Bim/Bod, Bcl-2, Bcl-xl, Bad and Bax from control cells (Par and sh-Con) and stable cell lines with reduced Id2 expression (sh-Id2C14 and sh-Id2C15). Vinculin levels were probed to ensure equal loading of all samples. (c) Western analysis of caspase-7/caspase-9 and PARP from control cells (Par and sh-Con) and stable cell lines with reduced Id2 expression (sh-Id2C14 and sh-Id2C15). Vinculin levels were probed to ensure equal loading of all samples. Id2, inhibitor of DNA-bind-2; PARP, poly (ADP-ribose) polymerase.

