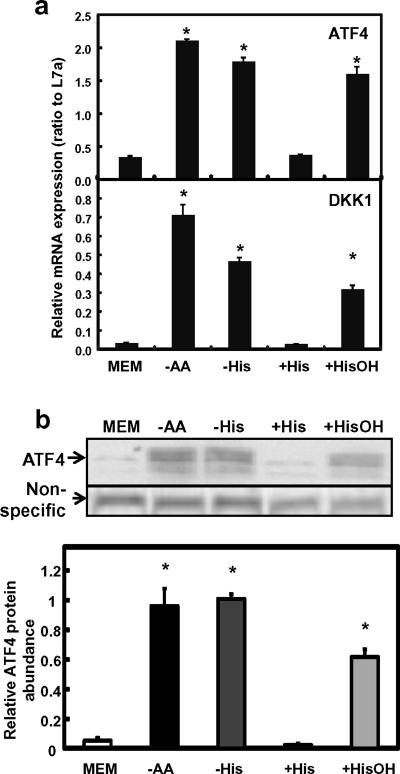
Fig. 3. DKK1 expression by total or single amino acid deprivation.
SW480 was treated with either MEM (complete), -AA (total amino acid deprivation), and -His or +HisOH (single amino acid limitation) for 8 h before samples were collected and analyzed. MEM+His was used as a negative control to amino acid starvation treatment (+His). a) mRNA expression of ATF4 and DKK1. Real time RT-PCR was performed for gene expression. L7a was used as the internal control and to normalize the data. Each bar represents the mean ± S. D. of three samples. Asterisks (*) represent statistical significance compared to values in MEM (P < 0.05). b) ATF4 protein expression analyzed by Western blotting. A non-specific band was used as the loading control to normalize the raw data. Each bar represents the mean ± S. D. of three independent samples. Asterisks (*) represent statistical significance compared to values in MEM (P < 0.05).

