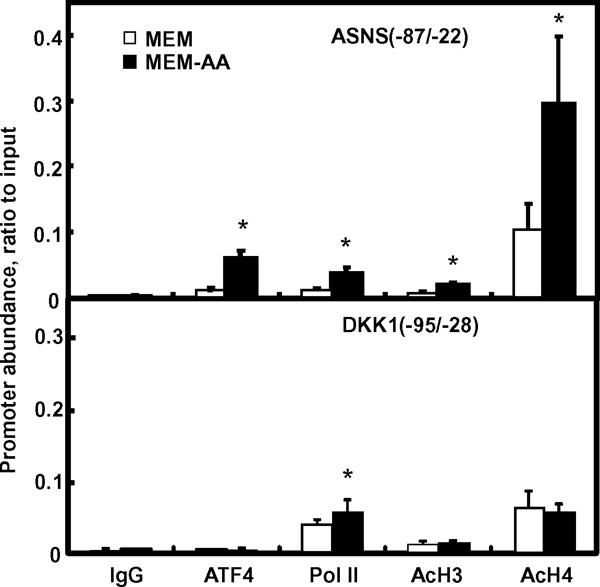
Fig. 5. Protein association at the promoter region of DKK1.

SW480 cells were grown in MEM or MEM-AA for 8 h. Samples were collected for chromatin immunoprecipitation assay. Primers located at the proximal promoter region of either DKK1 (−95/−28) or ASNS (−87/−22) were used in the real time PCR to quantify the association of promoter DNA to ATF4, Pol II, acetyl-histone H3, and acetyl-histone H4. Normal rabbit IgG was used as a negative control (IgG). Each bar represents the mean ± S. D. from three independent experiments. Asterisks (*) indicate statistical significance compared to values in MEM (P < 0.05).
