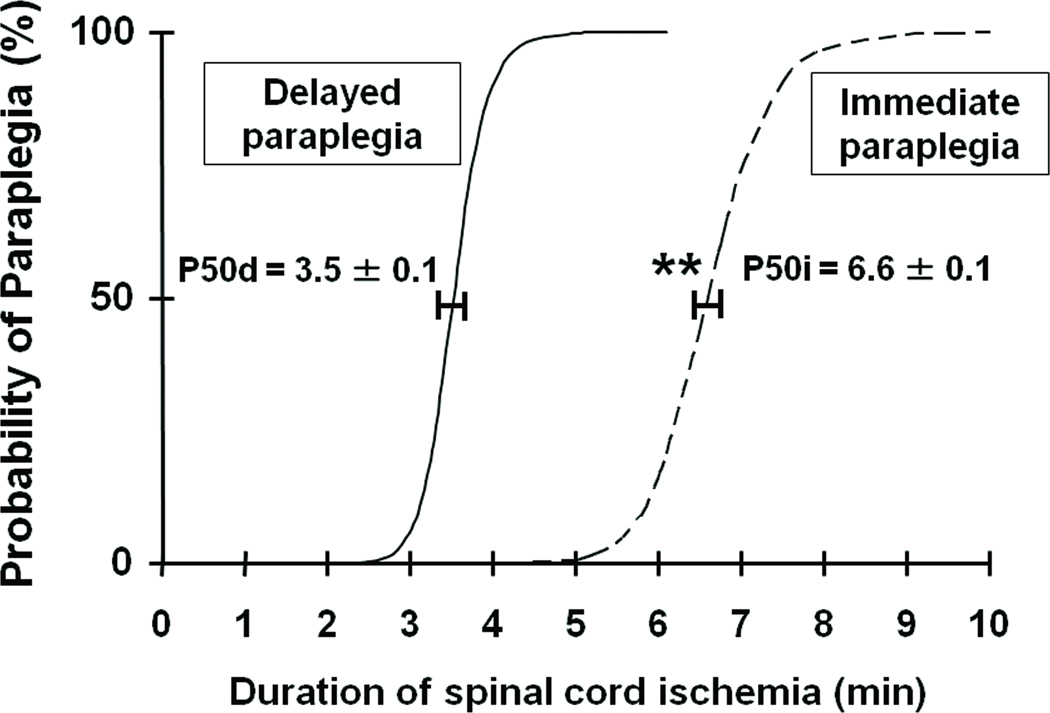
Figure 2.
Percentage of paraplegic mice as a function of the duration of SCI in minutes. The curves labeled “delayed” (solid line) and “immediate” (dashed line) show the probabilities of developing delayed and immediate paraplegia, respectively, calculated by quantal bioasay. The horizontal bars represent standard deviation at the probability of producing delayed and immediate paraplegia in 50 % of mice (P50d and P50i, respectively). **P<0.01 vs P50d.

