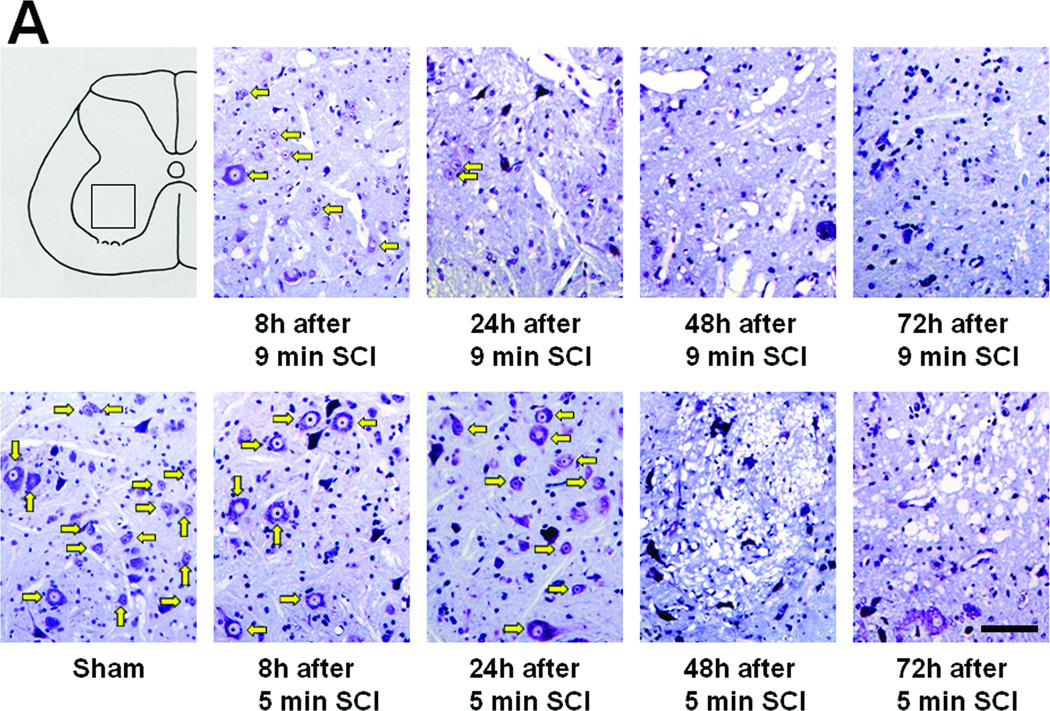
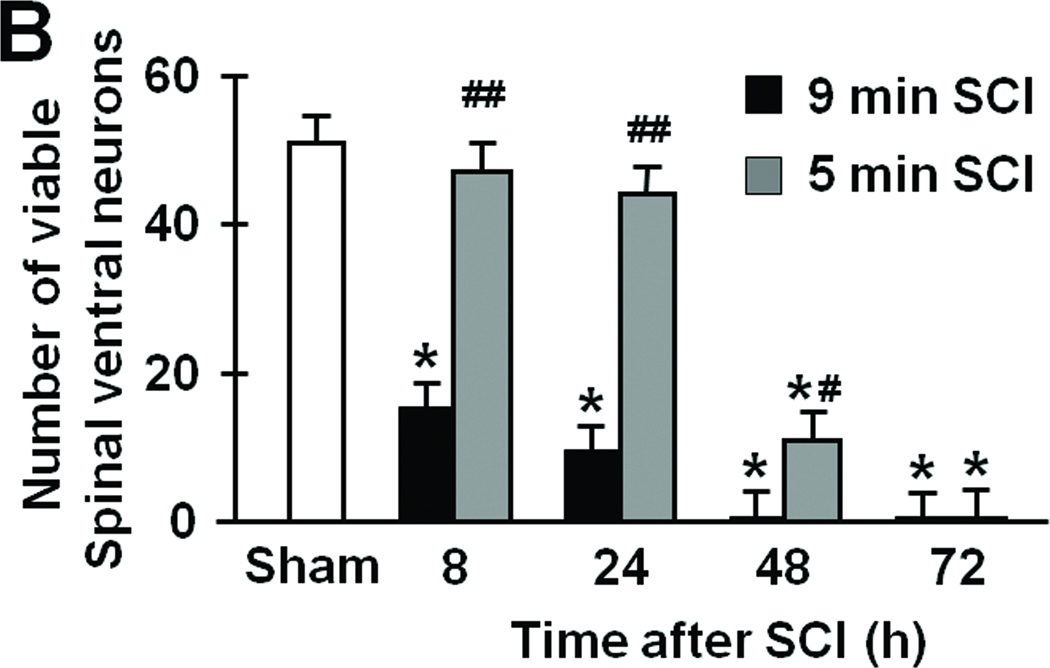
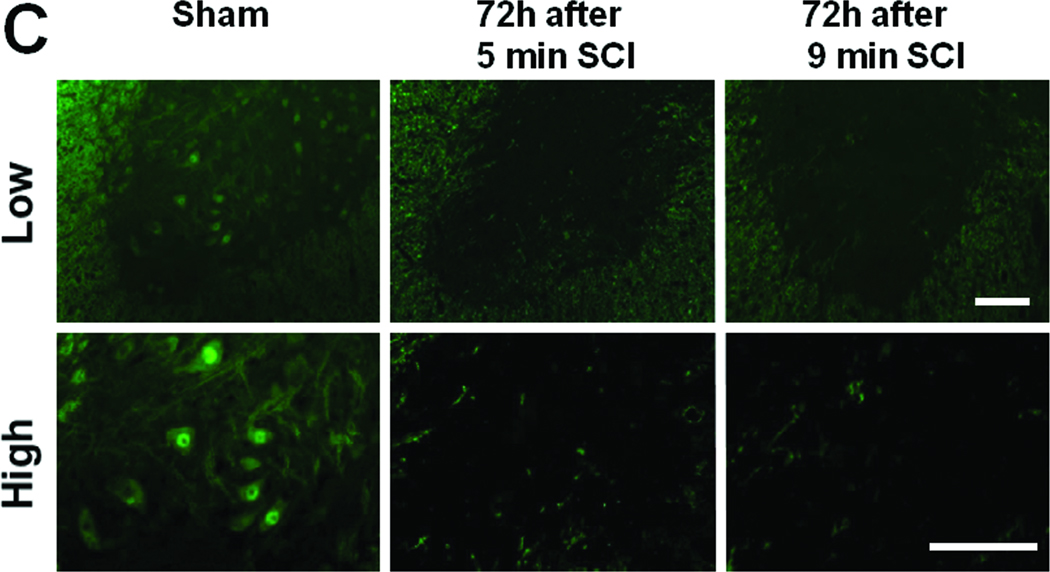
Figure 3.
(A) Representative photomicrographs of the lumber spinal cord sections of mice subjected to 9 or 5 min SCI showing cresyl violet (Nissl staining)-positive neurons. Yellow arrows indicate viable spinal ventral neurons. (B) Time-dependent changes in the number of viable spinal ventral neurons after 9 or 5 min SCI. N=4–7. * P<0.01 vs sham-operated mice. ## P<0.01 vs 9 min SCI. # P<0.05 vs 9 min SCI. (C) Representative photomicrographs of lumber spinal cord sections of mice showing NeuN-positive neurons (green) 72h after 9 or 5 min SCI. Size bars = 100 µm.


