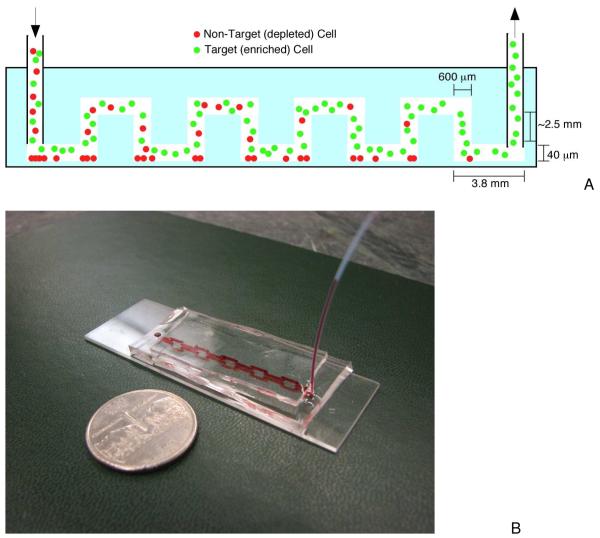
Figure 1.
Schematic of the microfluidic device. a) Side view of the negative enrichment device. Cell mixtures are loaded into the chip, where background (non-target) cells are captured and target cells pass through for collection at the chip outlet. b) Image of the experimental device. Red food coloring was introduced into separation channels to help visualization (the channel is reflected in the bottom glass in this image).

