
Figure 4.
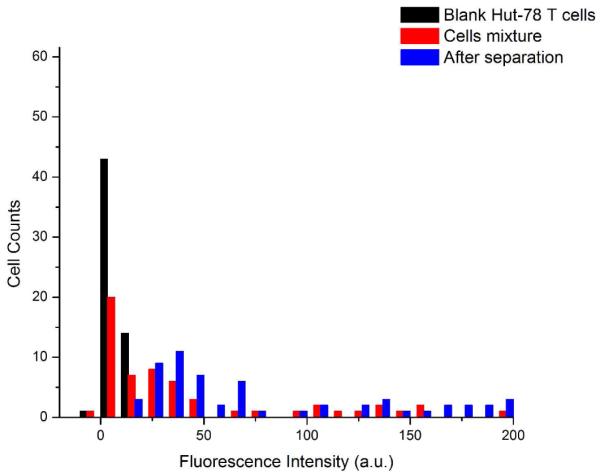
Fluorescence intensity histograms of cell mixtures and separated samples. Cell intensity (n = 59) was calculated for each experiment. Blank HuT 78 background cells (black) were used to set the fluorescence detection threshold. The cell mixture shows dim HuT 78 cells plus brighter C166-GFP cells expressing green fluorescent protein. The cells eluting from the chip (after separation) have the characteristically higher fluorescence of C166-GFP cells. C166- GFP cell concentration was 51.6% before separation and 95.8% after separation.