Figure 5.

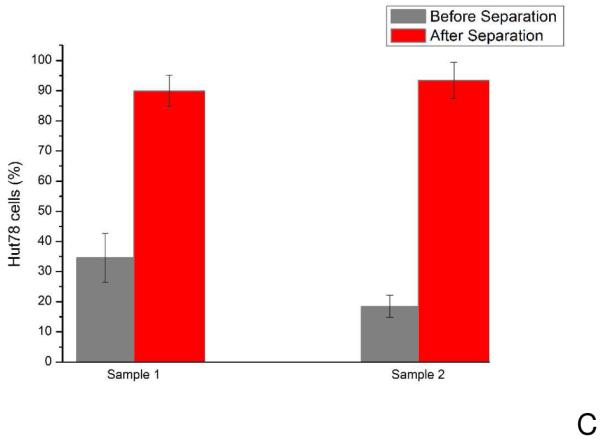
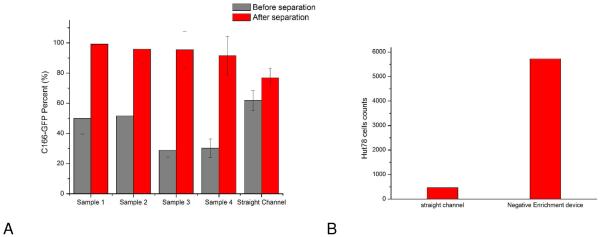
A) Enrichment of target cells (C166-GFP cells) of different initial mixture ratios. Sample 1 and 2 have 50% C166-GFP cells (HuT 78 cells were the background cells) with initial concentrations of 340±60 cells/μL and 1650±130 cells/μL, respectively. Sample 3 and 4 have approximately 30% C166-GFP cells in the initial mixture with total cell concentrations of 600±80 cells/μL and 1800±130 cells/μL, respectively. After collecting cells from outlet of the devices for 60 minutes, average C166-GFP purity of four samples was 96±3%. Straight channel chips operating under identical conditions (flow rate 0.05 mL/h) showed less enrichment. The initial C166-GFP ratio in the mixture was 60% with a total cell concentration of 720±80 cells/μL. Output of the straight channel chip was 77%, indicating the three-dimensional geometry enables superior cell separation. Error bars represent relative counting error (n=126, 193, 132, 106, 380, respectively). B) HuT 78 cell capture in the three-dimensional negative-selection device and a straight channel control. Samples containing 1100±164 cells/μL were introduced into both devices. The three-dimensional chip captured 5722 cells, compared with the straight channel chip, which captured 463 cells in the same experiment duration of 15 minutes. C) Enrichment of HuT 78 cells (target in this case) from Ramos cells using anti-CD19 chips. The HuT 78 cell percentage in Sample 1 was 35% with a total cell concentration of 1860±80 cells/μL. After separation the HuT 78 percentage was 90%. In Sample 2, the HuT 78 percentage was 18% with a total concentration of 3800±400 cells/μL. After separation the HuT 78 percentage was 93%. Error bars represent relative counting error (n=376 and 276 for samples 1 and 2, respectively).

