Figure 7.
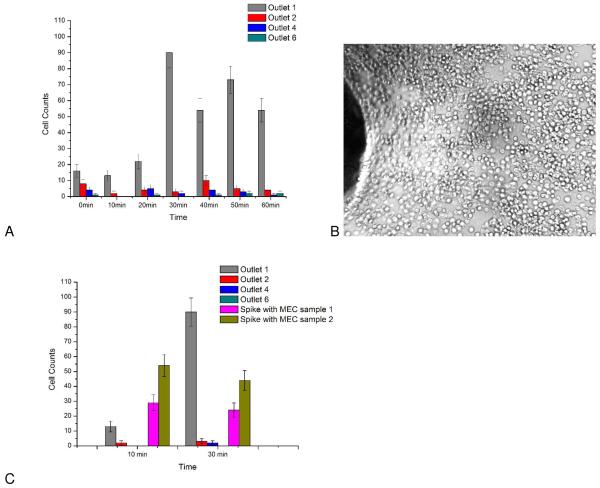
Depletion study of background HuT 78 cells. A) Cell throughput at different vertical channel interfaces (at bottom channel). Outlets 1,2,4,6 in the figure represent outlet area for bottom channel sections 1,2,4,6, respectively. Outlet 6 was the outlet of this device. Samples containing only Hut-78 T cells (1300±110 cells/μL) were introduced into anti CD71 coated devices. Every 10 minutes, a 30 second video was recorded for different outlets. Outlet 1 is seen to saturate at 30 minutes, however downstream outlets maintain efficient cell capture. B) Image of cell saturation on the surface at inlet 1 after 30minutes of separation. C) Comparison of cell throughout when target cells (C166-GFP, mouse endothelial cells (MEC)) are added to the sample. Initial C166-GFP cell concentration in Samples 1 and 2 were 540 cells/μL and 830 cells/μL, respectively. The output cell throughput increased according to C166-GFP initial concentration (Sample 1 = 29 cells, Sample 2 = 54 cells at 10 minutes). The output of outlet 6 was 0 cells. Exact cell counts are available in Supporting Information (Table S1 and S2). Examples of recorded videos are also available in supporting information (Video S2-S4).

