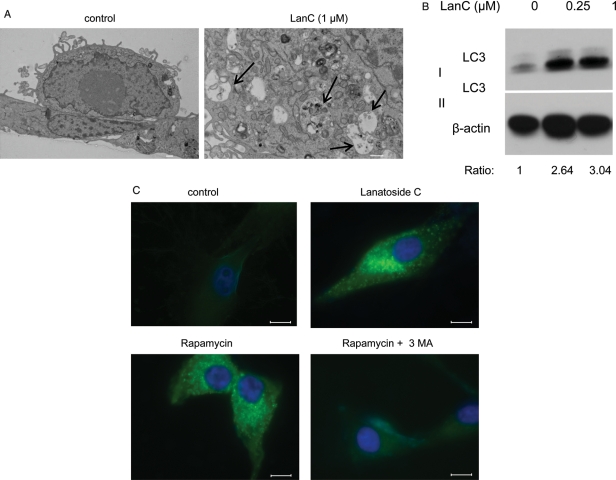
Fig. 6.
Lanatoside C induces autophagy. (A) Transmission electron micrograph of an untreated cell (original magnification, ×4000) or treated with 1 µM of lanatoside C (original magnification, ×8000). Arrows depict autophagosomes containing intracellular organelles (scale bar, 2 µm). (B) U87 cells treated for 16 h with lanatoside C (0.25 or 1 µM) were harvested and analyzed by western blotting using LC3 and β-actin antibodies. The ratio of LC3 II to β-actin is shown below the blot, with values normalized to the control sample. (C) U87 cells stably expressing LC3-GFP were treated with PBS, lanatoside C (1 µM), rapamycin (200 nM), or rapamycin (200 nM) in combination with 3MA (2 mM) for 24 h. Representative GFP fluorescent microscopic images of cells counterstained with DAPI (nuclei) are shown. Scale bar, 10 µm.

