
Figure 4.
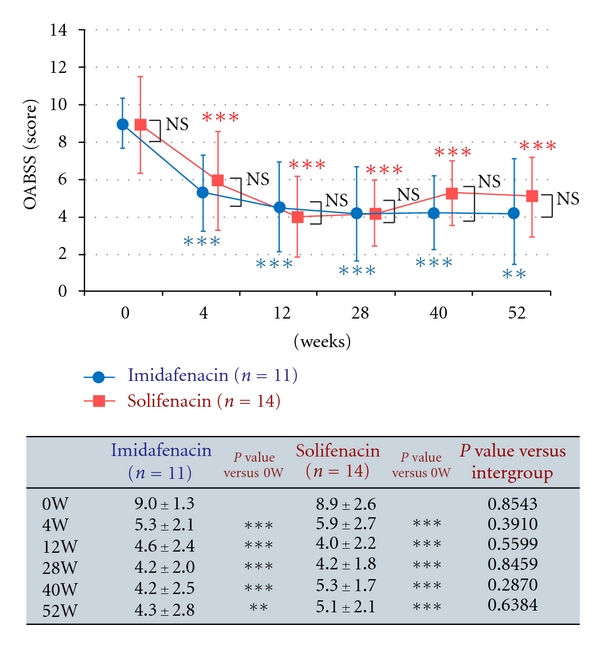
Changes in OABSS in the long-term analysis set. The endpoint is presented as a mean ± standard deviation. Intragroup comparison (versus the end of the observation period) by Wilcoxon test, **P < 0.01, ***P < 0.001. Intergroup comparison by Mann-Whitney U test, NS: not significant.