
Figure 5.
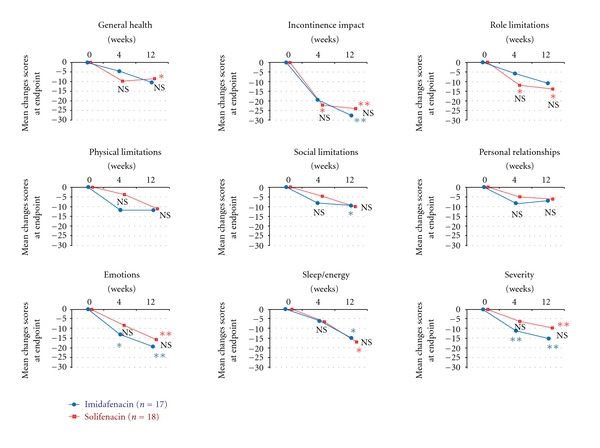
Mean changes in KHQ domain scores from baseline to endpoint in the short-term analysis set. The endpoint is presented as a mean. Intergroup comparison by Mann-Whitney U test, NS: not significant. Intragroup comparison (versus the end of the observation period) by Wilcoxon test, *P < 0.05, **P < 0.01.