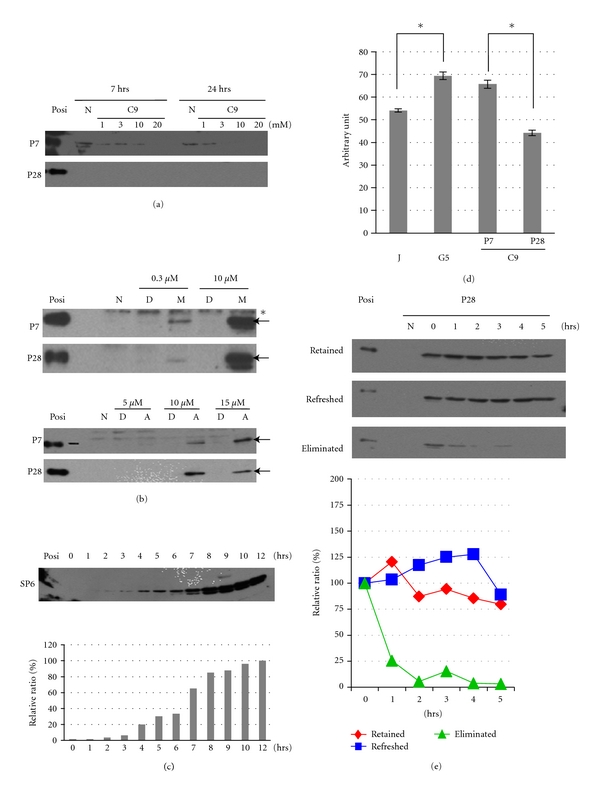
Figure 2.

Effects of protease inhibitors on SP6 expression level in C9 cells. (a) Dose-dependent effects of the lysosomal inhibitor, NH4Cl, on SP6 expression in C9 cells. The SP6 expression level was evaluated by WB. Posi: positive control; N: no treatment. (b) Dose-dependent effects of MG132 on SP6 expression in C9 cells. Upper panel: the cells were treated with MG132 (M) or DMSO (D) as a control (vehicle alone) for 7 h. Lower panel: cells were treated with ALLN (A) or DMSO (D) for 7 h. Posi: positive control; N: no treatment; arrow: SP6; asterisk: nonspecific band. (c) Time course of the effects of MG132 treatment on SP6 induction in C9 cells. C9 cells at P28 were treated with 10 μM MG132 during the indicated time. Upper panel: SP6 expression analysed by WB; Posi: positive control. Lower panel: Relative levels of signal intensity of WB. Each SP6 level was shown as the relative level compared with the signal detected at 12 h (100%). (d) 20S proteasome activity in G5 and C9 cells (P7 and P28). J: Jurkat cells (positive control). The brackets show the significant difference demonstrated by Student's t-test (n = 3, *P < 0.01). (e) Half-life analysis of SP6 in C9 cells at P28 determined by blocking de novo protein synthesis. C9 cells were pretreated with MG132 for 8 h, and then 10 μg/mL CHX was added during the indicated time. Upper panel: SP6 expression detected by WB; Retained: no medium change (MG132 was retained) when CHX was added; Refreshed: new medium replaced the old medium, and MG132 was newly added to the culture with CHX; Eliminated: the medium was replaced without MG132, only CHX was added; Posi: positive control; N: untreated C9 cells. Upper panel: relative SP6 expression level ratios. Each signal level was normalized with that at time 0 (100%). Data were reproduced by two independent experiments.
