Figure 7.

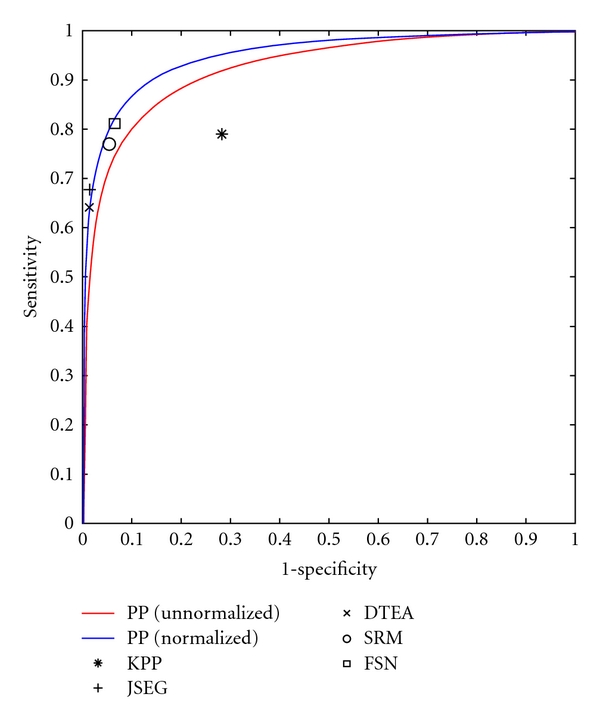
ROC curve comparing our PP model before normalization (red line) and after normalization (blue line) to 5 previously published methods.

ROC curve comparing our PP model before normalization (red line) and after normalization (blue line) to 5 previously published methods.