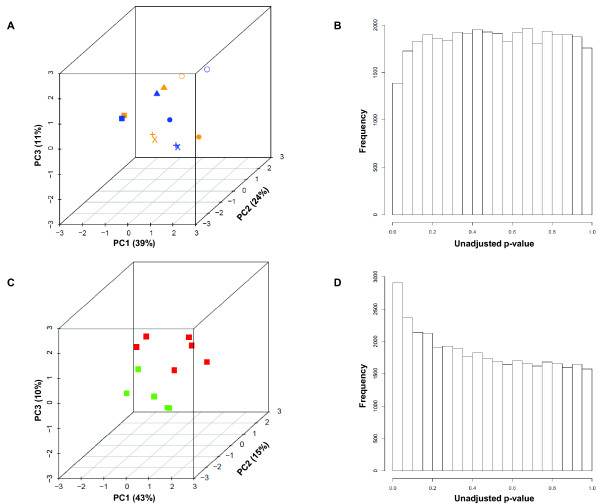
Figure 2.
Comparison of samples from different lobes; comparison of samples from biopsy and explant. In panels A and B, we compare samples from the upper (orange) and lower lobes (blue). In panels C and D, we compare samples obtained by biopsy (red) versus explant (green). (A) Upper and lower lobe samples are plotted according to expression of the first three Principal Components. [Key: each shape represents a lobar pair.] (B) Paired LIMMA tests were performed for every gene to compare expression between the upper and lower lobes; a frequency histogram shows the distribution of unadjusted p-values. (C) Biopsied and explanted samples are plotted according to expression of the first three Principal Components. (D) Unpaired LIMMA tests were performed for every gene to compare expression between biopsies and explants; a frequency histogram shows the distribution of unadjusted p-values.

