
FIG. 1.
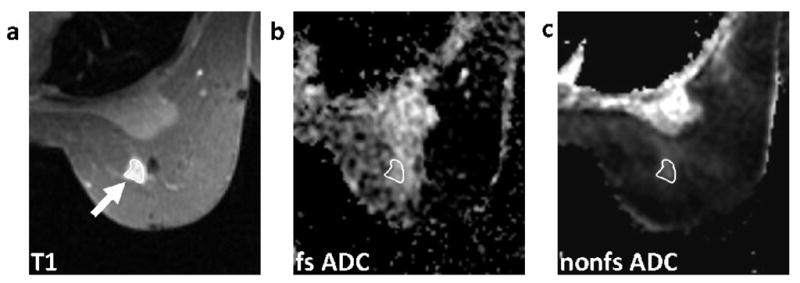
Methodology for ROI measurement. As illustrated, the tumor ROI was defined free-hand on the axial post-contrast T1-weighted image (a) and propagated to the corresponding position on fat-suppressed (b) and non-fat-suppressed (c) ADC maps. ROIs were drawn at the central slice of the tumor with care taken to exclude regions of fat as identified on the T1-weighted image (a). Mean ADC was calculated for the ROI on each of the ADC maps (b,c).