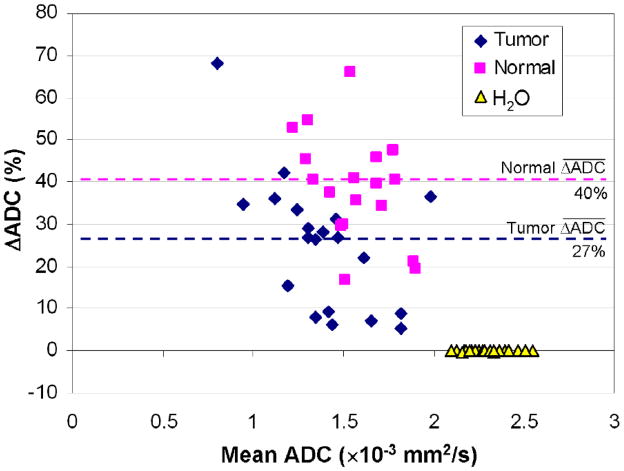
FIG. 2.
Comparison of breast ADC values measured with and without fat suppression. Bland-Altman plot shows the ADC difference (ΔADC), expressed as a percent of the fat-suppressed value, versus the mean of the fat suppressed and non-fat suppressed ADC values for tumors, normal fibroglandular tissue and the water phantom that was included in each scan. Dotted lines indicate mean differences. ADC values for tumor and normal tissue were significantly lower when fat suppression was not used (p<0.0001 for both), while no differences were observed for the water phantom (p=0.17).

