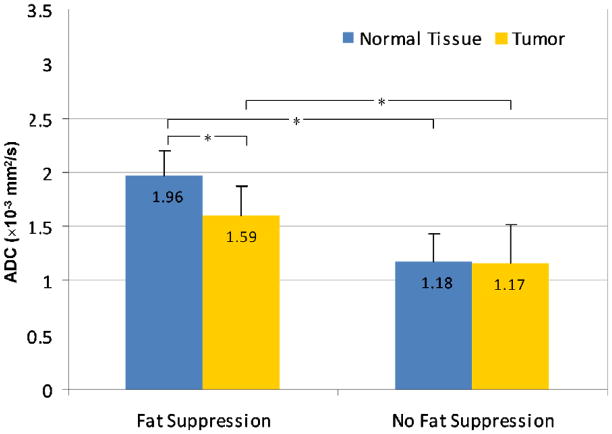
FIG 3.
Mean ADC measures for tumor and normal tissue, with and without fat suppression. Error bars represent standard deviations. Asterisks (*) indicate significant differences (p<0.0001) between paired measures by Wilcoxon Sign-Rank Test. ADC values measured without fat suppression were significantly lower than those measured with fat suppression for both tumor and normal tissue; tumors exhibited significantly lower ADC than normal tissue with fat suppression (p<0.0001) but not without (p=0.37).

