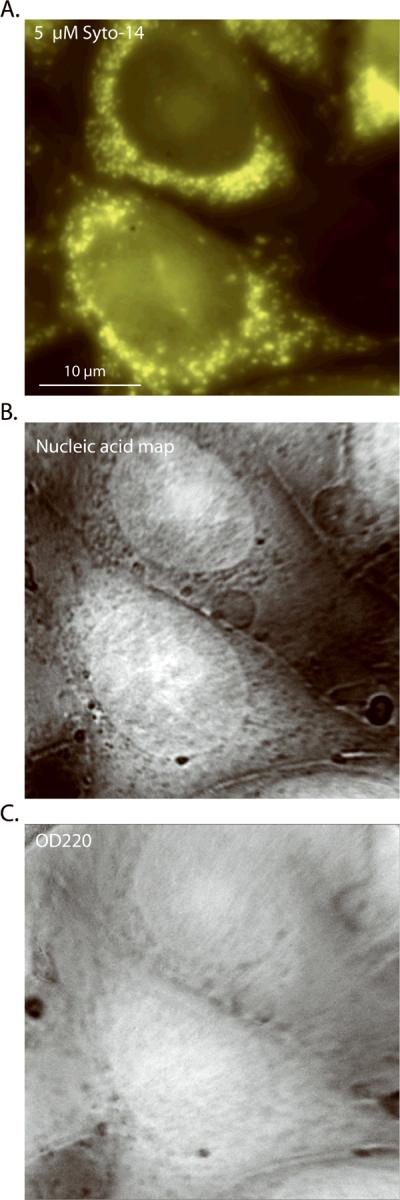
Figure 2. High-resolution, images of CHO-K1 cells using a 100×, 1.2 NA objective.

(A) 5 μM Syto-14 stain, (B) nucleic acid mass map deduced from the 260-nm and 280-nm images, (C) OD220 nm image, which closely approximates the protein mass map (see text).
