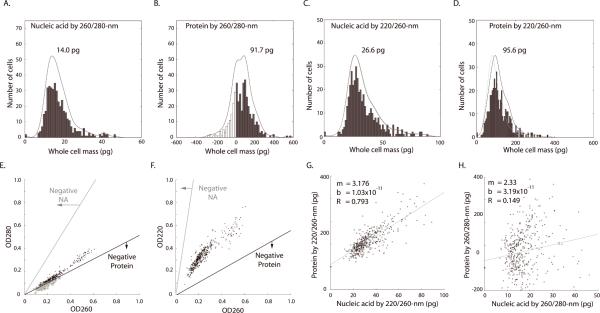
Figure 3. Distribution and comparison of whole-cell nucleic acid and protein mass calculated by deep-UV algorithms.
Histograms (n = 420 cells, bins: 50) of nucleic acid (A) and protein mass (B) calculated using 260/280-nm and nucleic acid (C) and protein (D) by 220/260-nm algorithms. The same manually defined radius of interest (ROI) was used, for each cell, for all histograms. Black lines are the fitted distributions for the histogram (single-degree polynomial with `polyfit' function in MatLab.) Gray lines (C and D) denote the distribution of protein mass calculated using an ε-220 value derived using the work of Kuipers and Gruppen (28) and Rosenheck and Doty (29), without hypochromic correction (see text). Black lines (C and D) show distribution calculated using an ε-220 value corrected for the hypochromic shift (see text). (E) Two-dimensional scatter plot showing the distribution of OD280 and OD260 across all cells. The lower line (black) denotes the OD combinations that produce zero protein mass; OD combinations below this line result in non-physiological, “negative” protein mass (circles). Note the proximity of OD values for the 260/280-nm algorithm to the zero-mass line for protein by the 260/280-nm algorithm, as is consistent with the negative and near-zero values observed in Fig. 3B. The upper line (E, gray) denotes the OD combinations that would yield negative nucleic acid mass. (F) A similar scatter plot and noise analysis for the 220/260-nm algorithm. Note that OD values in Fig. 3E fall within a range halfway between the two zero-mass lines. Therefore the 220/260-nm calculation is optimal for maximizing signal-to-noise ratio for both nucleic acid and protein mass. (G) The 220/260-nm calculation shows nucleic acid and protein as correlated (R=0.79, cells = 420). (H) However, whole-cell protein mass calculated by 260/280-nm shows little correlation to the nucleic acid mass (R = 0.149). The different result is attributed to the higher noise of the 260/280-nm algorithm, which hides the real relationship (see text). Regression fit was implemented using least squares method in MatLab.

