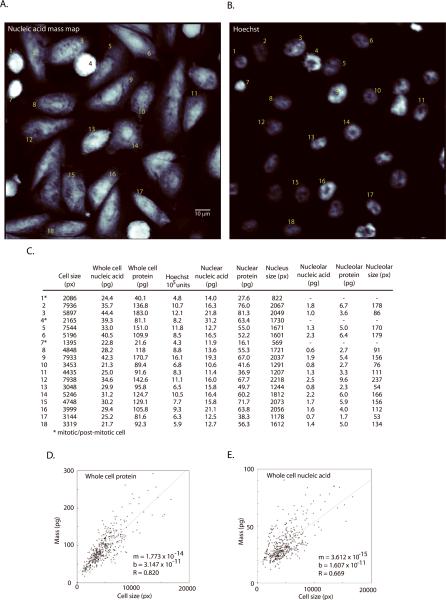
Figure 5. Mass distributions in the whole cell, nucleus and the nucleolus.
(A) nucleic-acid mass map and (B) Hoechst channel for a representative field of CHO–K1 cells imaged at 32× magnification. (C) A table listing nucleic acid mass, protein mass and fluorescence values. Keys 1–18 correspond to labels on the images. Mass values are reported for the whole cell (all compartments), nucleus (with nucleolus), and nucleolus, as determined from the Hoechst image. (D) and (E) show scatter plots that relate cell size (2-dimensional projection) to total protein and total nucleic acid content. Although mass generally increases as a function of size, there can be more than a 2× difference in protein mass for cells of a given size.

