Figure 4.
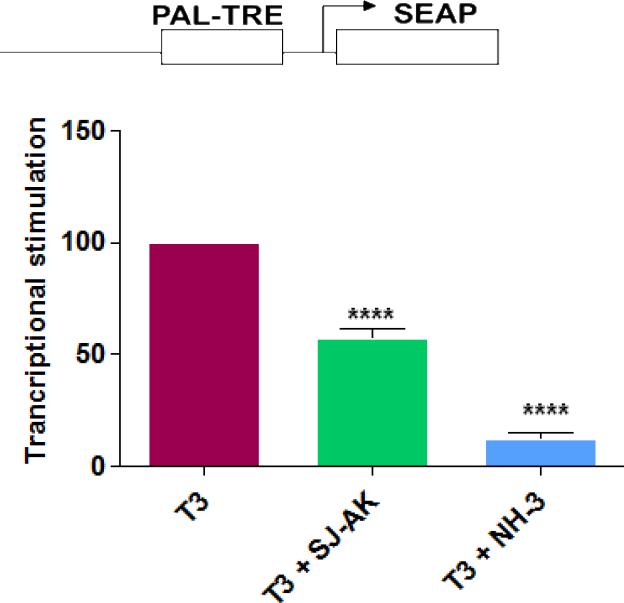
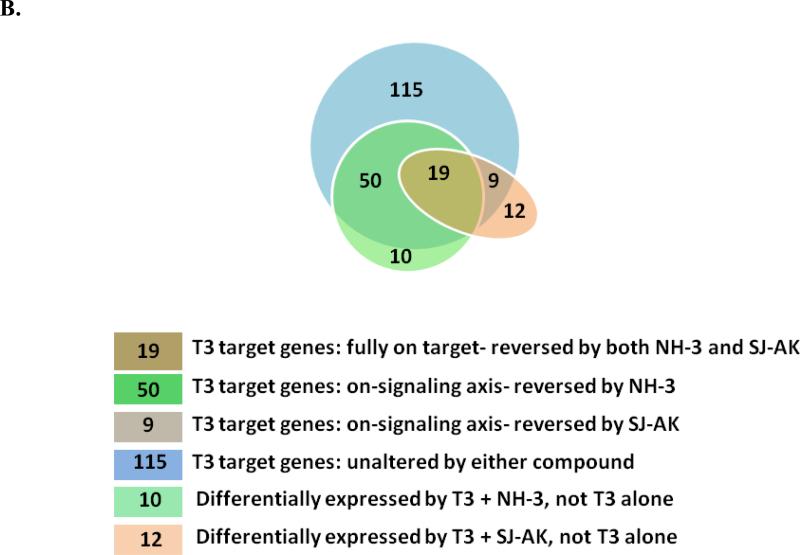
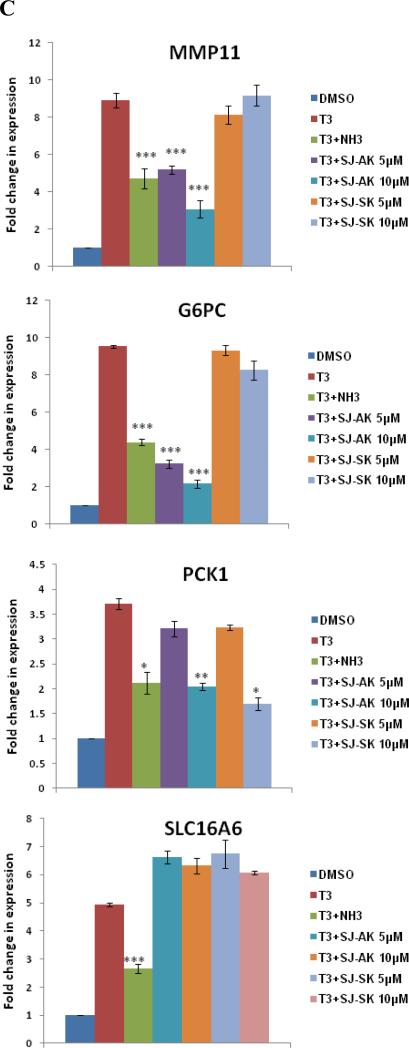
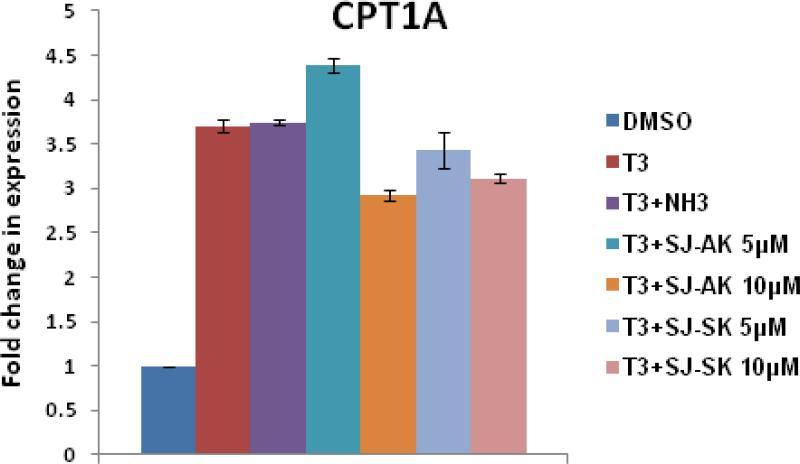
Microarray gene expression analysis in HepG2 cells. A, Representative heat map of the 78 T3 target probe sets whose differential expression by T3 is affected by the TR inhibitor compounds: SJ-AK and NH-3. Average signal log ratios vs. either DMSO or T3 are used to generate the heat map. B, Venn diagram illustrating the global gene expression effects of treatment of HepG2 cells with T3 alone or in combination with either NH-3 or SJ-AK. . C, qRT-PCR experiments on T3 target genes identified in the microarray experiment. T3 was added at a concentration of 100 nM alone or in combination with either SJ-AK or NH-3. qRT-PCR was carried out to amplify MMP11, PCK1, G6PC, SLC16A6, OSTβ, CYP24A1, CYP3A4 C8ORF4 and CPT1A genes. ΔΔCt method was used to calculate fold induction of expression. *** indicates p < 0.005, ** indicates p < 0.01 relative to T3 effect.


