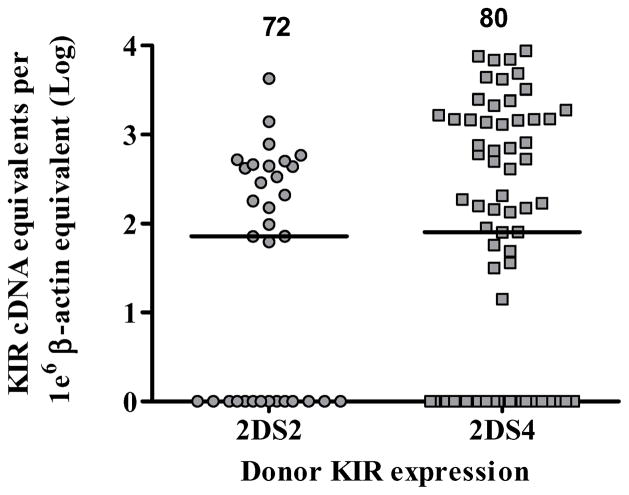
Figure 1. KIR2DS2 and KIR2DS4 expression by mRNA-based Q-PCR in the donor.
KIR2DS2 and KIR2DS4 expression was reported only in the presence of the corresponding genotype. KIR2DS2 is represented in circles and KIR2DS4 in squares. The copy number for each subject was normalized to 1×10⁶ β-actin copies and the median copy number is shown at the top of each group. The null-expressers are represented as log 100=1 on the y axis.

