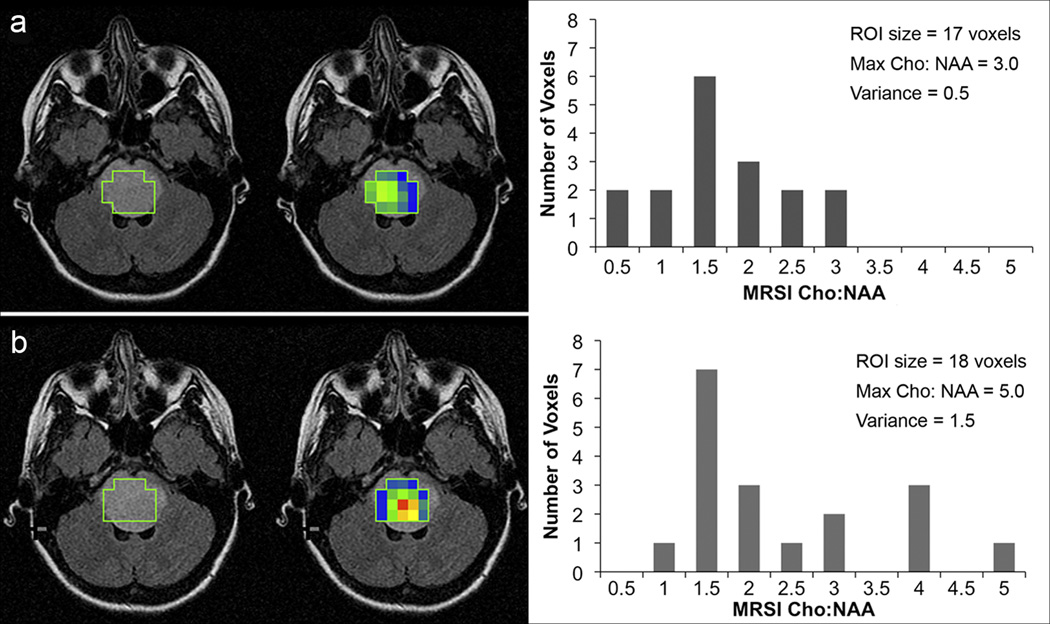
Fig. 3.
Changes in the variance of Cho:NAA values for one patient. FLAIR images with ROI selection (left), FLAIR images fused with Cho:NAA color maps (center) where blue = minimum, red = maximum (values range from 0.5 – 5.0) and histograms (right) showing the distribution of Cho:NAA values within each ROI. a) Results from the first scan on study. b) Results from the second scan on study (7 weeks later). The variance in Cho:NAA was much greater in the second scan. Overall survival for Patient was 13.6 months.

