
Figure 2.
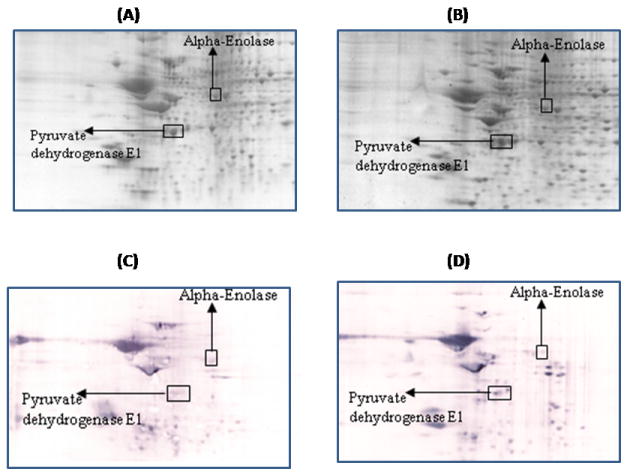
Representative 2D gel images of the brain proteome from 6M-old wild type (A) and 6M-old APP/PS1 mice (B). C and D represent the oxyblots of brain from 6M-old wild type and 6M-old APP/PS1 mice respectively, showing geographical location of proteins on 2D gel and blot identified by mass spectrometry that showed differences in specific carbonylation. Spots that showed a significant difference in specific carbonylation levels are boxed and labeled with the corresponding protein identity. (n=6 separate WT and APP/PS1 mice).