
Fig. 10.
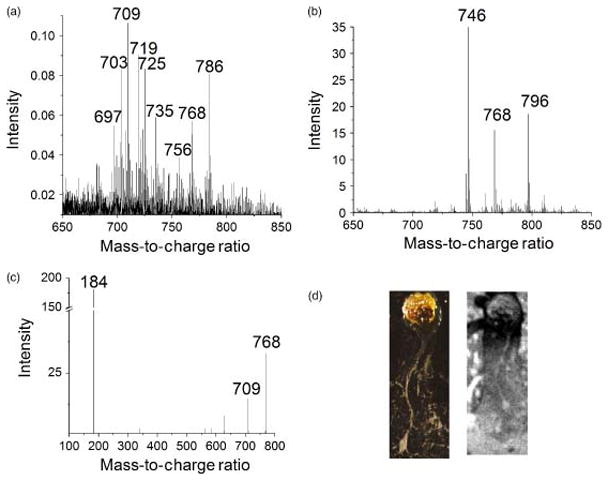
Lipid profile obtained from a single neuron with SIMS (a) and from a compilation of neurons with MALDI (b). The tandem MS spectrum shows that m/z 709 and 184 are major fragments of m/z 768.5, the sodiated adduct of major lipid component m/z 746.5 (c). Optical image (d, left) and black and white SIMS total ion image (d, right) of cultured aplysia neuron on silicon wafer (image size 2.00 × 4.75 mm). [102]