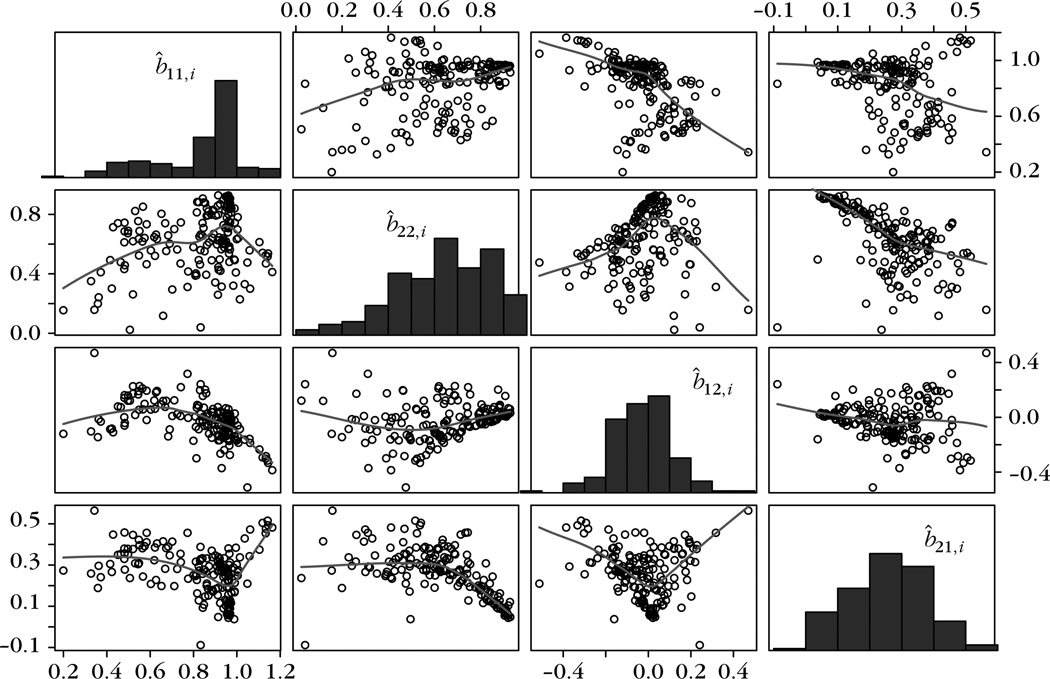
Figure 3.
Matrix scatterplots of the b̂i estimates using the DP prior, as averaged across three Markov chains. A loess line is imposed on each of the scatterplots. The diagonal plots are histograms of these estimates. For b11,i, M = 0.83, SD = 0.20, 90% CI [0.44, 1.05]; for b22,i, M = 0.64, SD = 0.21, 90% CI [0.26, 0.91]; for b12,i, M = −0.03, SD = 0.14, 90% CI [−0.28, 0.20]; and for b21,i, M = 0.26, SD = 0.12, 90% CI [0.06, 0.46].

