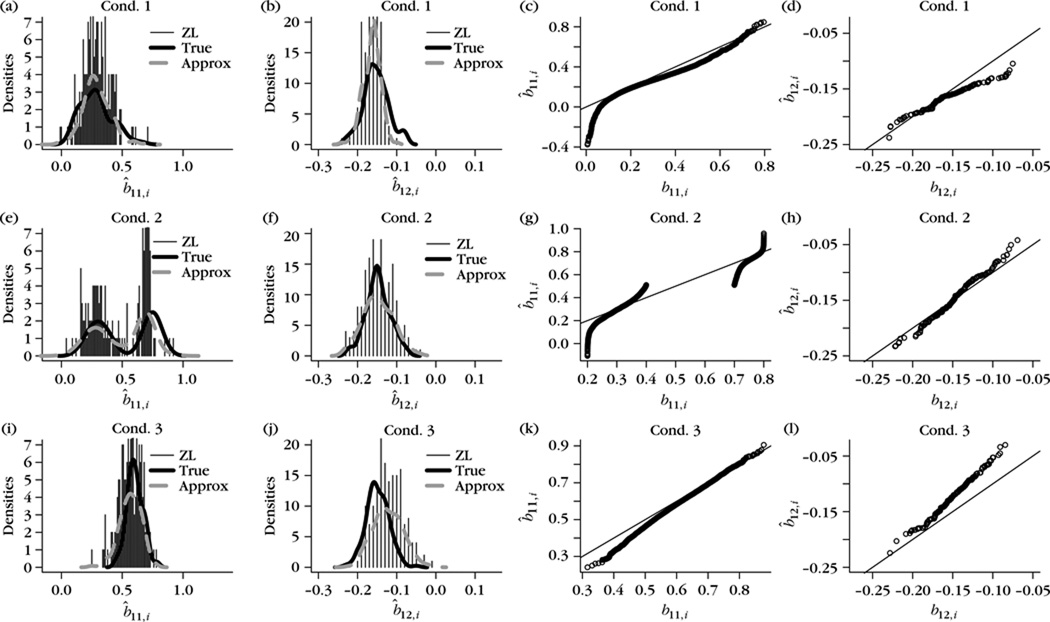
Figure 6.
(a), (e), (i) True density of b11,i, the approximation density constituted by b̂i for conditions 1, 2, and 3, respectively. (b), (f), (j) The corresponding plots associated with b12,i. (c), (g), (k) Quantile–quantile plots comparing the true and estimated b11,i pooled across all Monte Carlo runs; the straight line provides the reference for y = x. (d), (h), (l) Quantile–quantile plot comparing the true and estimated b12,i; the straight line provides the reference for y = x.

