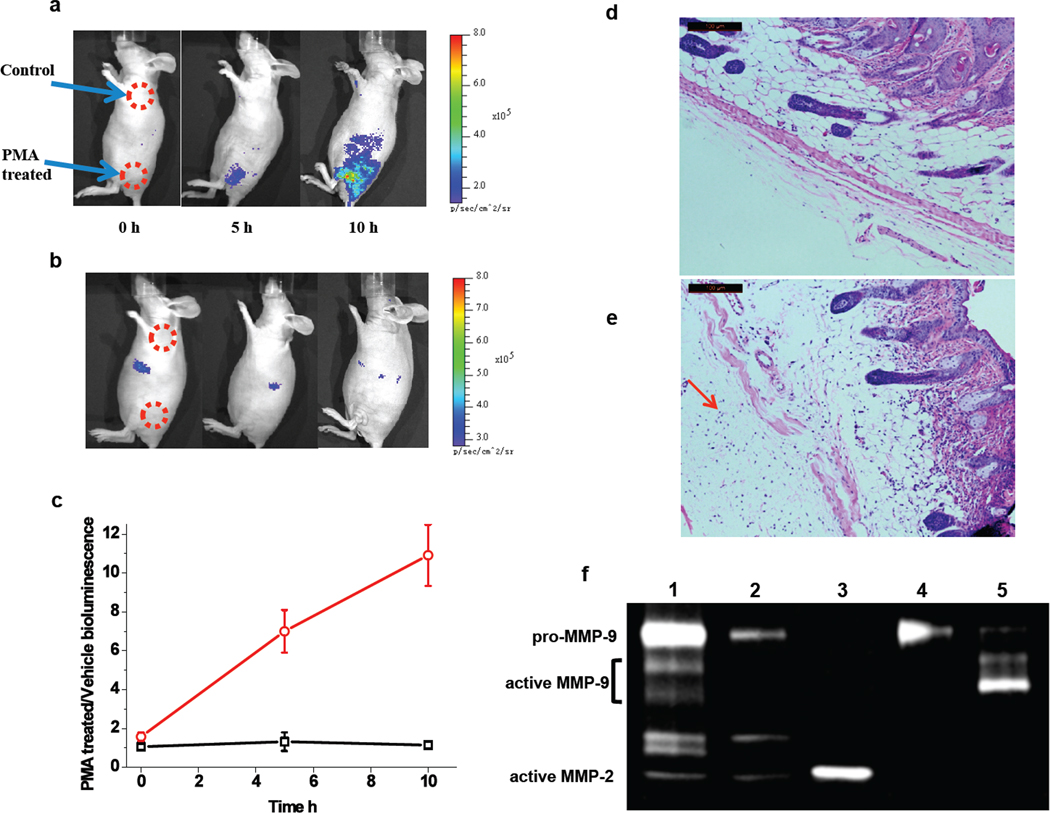
Fig. 6.
Imaging the MMP-9 activity in the inflammation site of a living mouse. (a) To induce inflammation, phorbol 12-myristate 13-acetate (PMA) (10 µg in acetone) was topically applied on the low left flank of the mice for three times in a week. The same volume acetone was applied on the shoulder as the control. qCB-Luc (10 pmol) was i.v. injected, and coelenterazine (10 µg) was i.v. injected before imaging (exposure time: 20s). (b) MMP activity imaging after an i.p. injection of 500 µg of inhibitor SB-3CT 2 h before the injection of the MMP reporter. (c) Plot of the ratio of activated bioluminescence at the inflammation sites over the control sites without (red curve) and with (black curve) the i.p. injection of SB-3CT. The skin samples were collected for H & E staining after imaging: (d) the cross-section of the normal skin, and (e) the skin of the inflammation site with extensive infiltration of neutrophils (indicated by a red arrow) and the destruction of the tissue. (f) Gelatin zymography analysis of the homogenized skin samples shows elevated MMP-9 activity in the inflamed skin. Lane 1, PMA-treated skin sample; Lane 2, vehicle-treated skin sample; Lane 3, active MMP-2 standard; Lane 4, pro-MMP-9 standard; Lane 5, activated MMP-9 by incubation of pro-MMP-9 with 1 mM of 4-aminophenylmercuric acetate at 37°C for 30 min.

