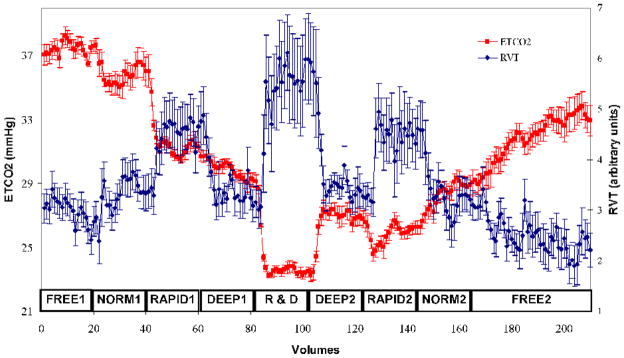
Fig. 1.
Plot of average end-tidal carbon dioxide (ETCO2, red) and respiration volume per time (RVT, blue) timecourses for all subjects throughout the experiment. Error bars represent standard error of the mean. The labels immediately above the x-axis refer to the different breathing conditions in Table 1. NORM = NORMAL, R&D = RAPID&DEEP.

