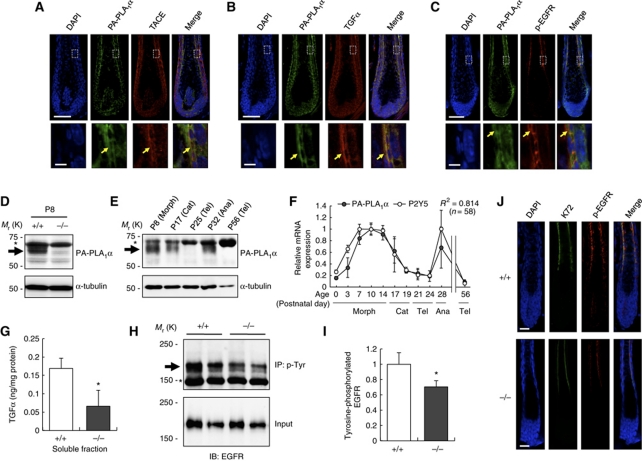
Figure 4.
PA-PLA1α is co-expressed with TACE, TGFα and p-EGFR in hair follicles and EGFR signalling is reduced in PA-PLA1α−/− mice. (A–C) Immunofluorescent staining of PA-PLA1α with TACE (A), TGFα (B) and phosphorylated form of EGFR (p-EGFR) at Tyr1068 (C) in WT dorsal hair follicles. The arrows indicate co-expression of PA-PLA1α with each protein. Nuclei were stained with DAPI. Magnified views of the boxed areas are shown in the bottom panels. (D) Immunoblot analysis of PA-PLA1α in dorsal skin lysate. Lysate of skin from P8 WT (+/+) and PA-PLA1α−/− (−/−) mice was subjected to immunoblot using anti-PA-PLA1α antibody. The membrane was stripped and reprobed with anti-α-tubulin antibody as a loading control. The arrow and asterisk denote PA-PLA1α and non-specific bands, respectively. (E) Hair cycle-dependent expression of PA-PLA1α in dorsal skin. Skin specimens at different hair cycle stages were analysed by immunoblot as described above. Note that first hair cycle starts with catagen (P17). Morph, morphogenesis; Cat, catagen (regression); Tel, telogen (resting); Ana, anagen (growth). (F) qRT–PCR analysis of hair cycle-dependent expression of PA-PLA1α and P2Y5 mRNA in WT dorsal skin. The number of transcripts was normalized to Gapdh and the maximal value of each gene was set at 1 (n=3–5). R2, squared correlation coefficient between PA-PLA1α level and P2Y5 level. (G) Soluble TGFα level in vibrissa hair follicles from WT and PA-PLA1α−/− mice. Lysate of vibrissa hair follicles during the growth phase were ultracentrifuged and the supernatants were subjected to TGFα sandwich ELISA. Amount of soluble TGFα was normalized to total protein in the same sample determined by the BCA method (mean±s.e.m.; n=4). (H) p-EGFR level in dorsal skin. Tyrosine-phosphorylated proteins were immunoprecipitated from skin lysate during the hair growth phase using anti-phosphotyrosine (p-Tyr) monoclonal antibody (PY20). The immunoprecipitates (IP) and aliquots of total dorsal skin lysate (Input) were subjected to immunoblot with anti-EGFR antibody. The arrow and asterisk indicate bands corresponding to p-EGFR and IgG, respectively. (I) Densitometric analysis of p-EGFR in (H). The IP intensity was normalized to the input intensity in the same sample and the mean value in +/+ sample was set at 1 (mean±s.e.m.; n=4). (J) Immunofluorescent staining of p-EGFR at Tyr1068 and K72 in WT and PA-PLA1α−/− hair follicles. Nuclei were stained with DAPI. Scale bars represent 50 μm (A–C, upper panels), 5 μm (A–C, bottom panels) and 20 μm (J). *P<0.05 versus +/+.

