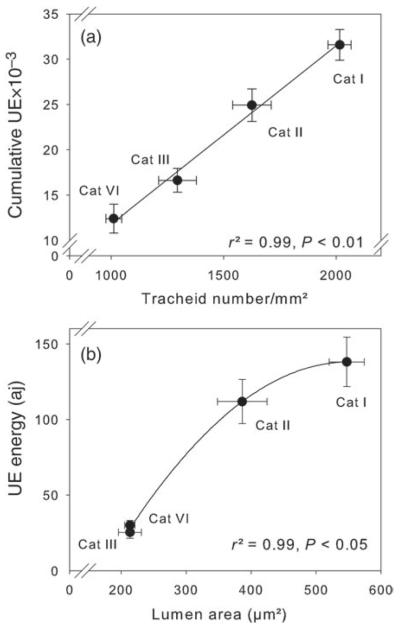
Figure 2.
Relationship of wood structure and UE parameters. Plots of tracheid number per square millimetre transverse surface versus cumulative number of UEs (a) and mean UE energy versus mean lumen area (b) of standard size wood splits are given. For description of categories (Categories I–IV), see Figure 1. Error bars represent one standard error. Significant relationships between traits are indicated by linear (a) and quadratic (b) regression lines.

