Figure 5.

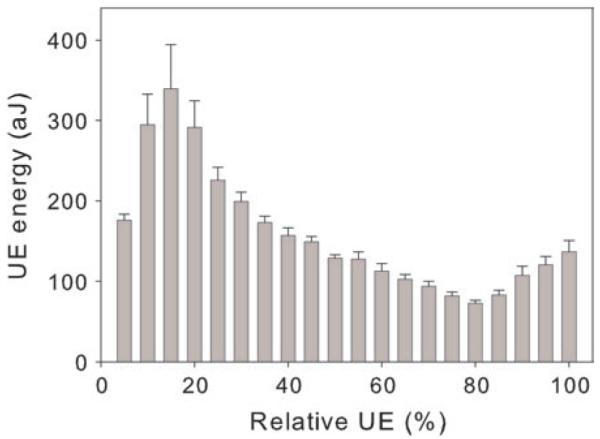
Course of UE during dehydration of entire branches. Mean UE values in 5% steps of the cumulative number of UEs (relative UE) of two Norway spruce branches are given. Whiskers of the columns indicate one standard error.

Course of UE during dehydration of entire branches. Mean UE values in 5% steps of the cumulative number of UEs (relative UE) of two Norway spruce branches are given. Whiskers of the columns indicate one standard error.