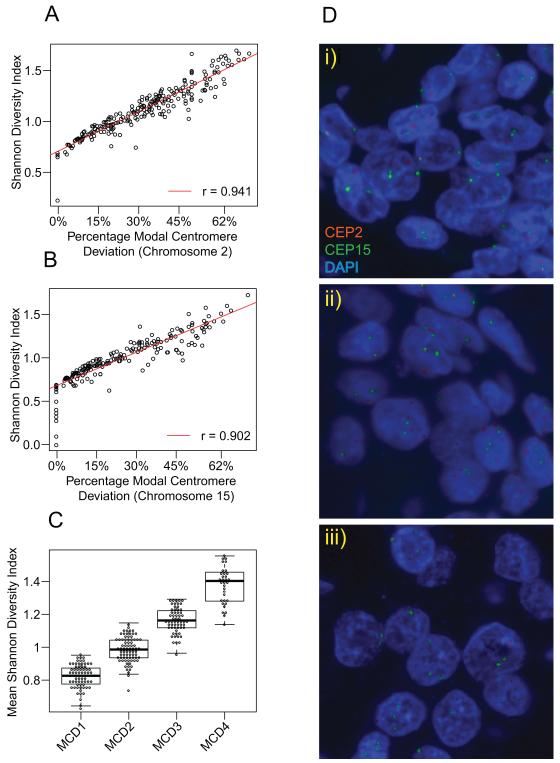
Figure 2. Relationship of CIN scores to Shannon Diversity Index.
Correlation of modal centromere deviation with Shannon Diversity Index for chromosome 2 (Figure 2A) and chromosome 15 (Figure 2B). The MCD4 extreme CIN cohort has the highest mean (Chromosome 15 and 2) Shannon Diversity Index (Figure 2C) Representative images of MCD4 cohort tumours (Figure 2D). Centromeric probes of chromosome 2 and chromosome 15 were labelled in red and green respectively.

