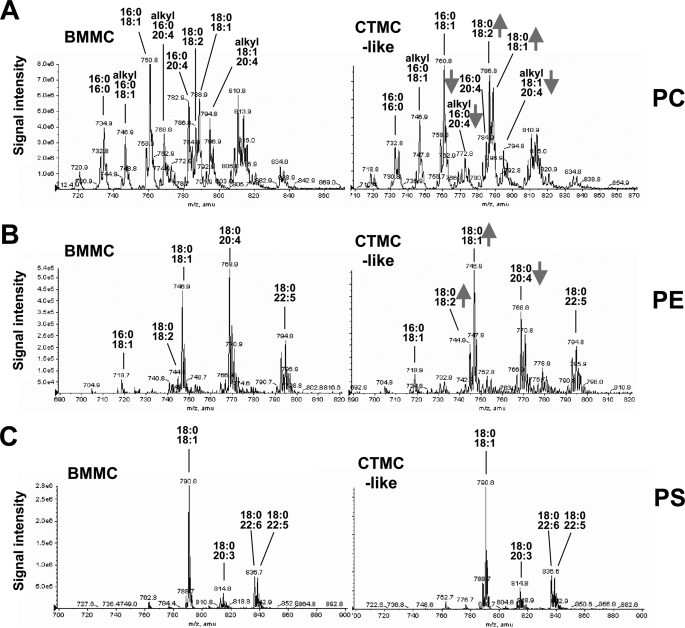
FIGURE 4.
ESI-MS profiles of phospholipids in BMMCs and CTMC-like cells from C57BL/6 mice. IL-3-maintained BMMCs (left panel) and CTMC-like differentiated cells after coculture for 4 days with Swiss 3T3 cells (right panel) were subjected to ESI-MS for PC, PE, and PS. Fatty acid compositions of major peaks are indicated. Peaks reduced or increased in CTMC-like cells relative to BMMCs are shown by arrows.

