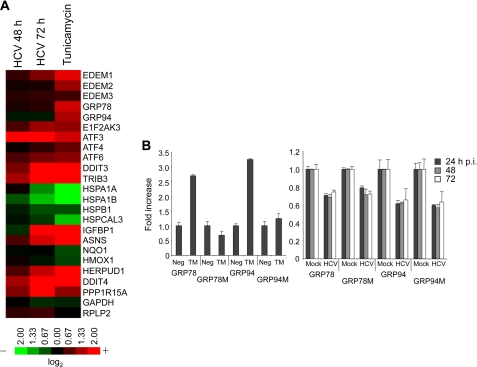
FIGURE 2.
Comprehensive analysis of ERAD gene expression in JFH-1-infected HuH-7.5.1 cells. A, HuH-7.5.1 cells treated with TM (5 μg/ml) for 12 h or infected with JFH-1 for 48 and 72 h were subjected to microarray analysis, along with their negative controls. Expression of ER stress genes is shown as a heat map. Red and green indicate up- and down-regulation, respectively. Information on each gene shown is indicated on the 3D-Gene web site. B, GRP78 and GRP94 induction in TM-treated (left) and HCV-infected cells (right). GRP78M and GRP94M represent the defective promoters. The mean ± S.D. (error bars) of three independent experiments are shown.

