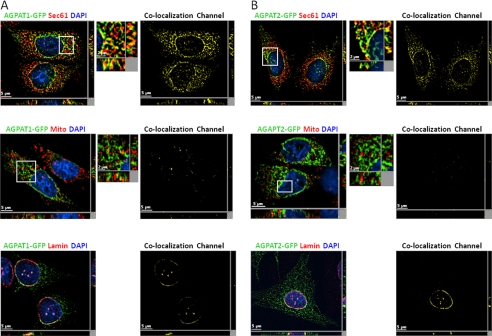
FIGURE 2.
Localization of AGPAT1-EGFP and AGPAT2-EGFP to endo-membranes in cultured cells. A, CHO cells overexpressing AGPAT1-EGFP were fixed in methanol, incubated with antibody sec61-β (specific for endoplasmic reticulum) and lamin A/C (specific for nuclear lamina), and imaged for green and red fluorescence using fluorescence microscopy. Shown are representative images for AGPAT1 (green fluorescence), sec61-β (red fluorescence), DAPI (blue fluorescence), co-localization channel (yellow fluorescence). The AGPAT1-GFP-expressing cells were incubated with MitoTracker Red dye, fixed in 4% paraformaldehyde, and imaged as before. B, fluorescence images for AGPAT2-EGFP expressed in CHO cells. Cells for sec61-β, lamin A/C and mitochondria were processed as above. Shown for each image is a single z-stack image, whereas the x and y axis shows the z-stacks. Scale bar, 5 μm for larger images and 2 μm for higher magnification images.

